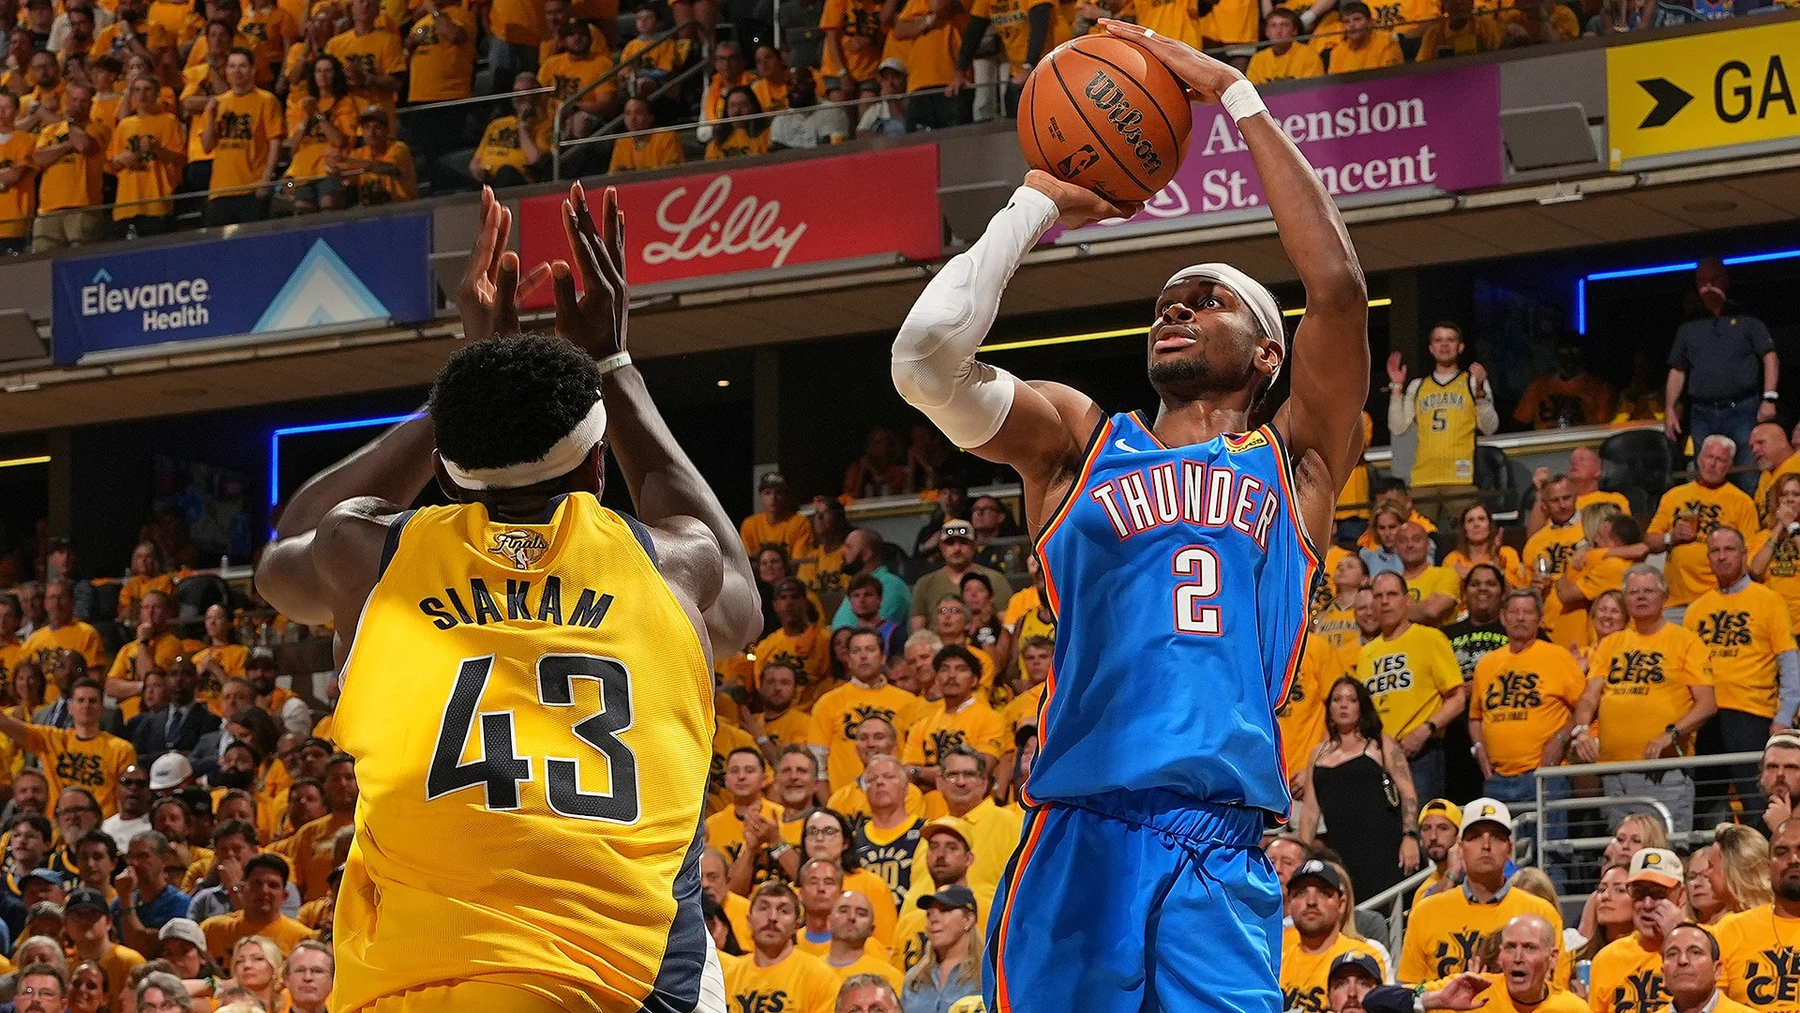
Oklahoma City finished the 2024–25 NBA regular season with the league's best record at 68–14. Cleveland led the Eastern Conference at 64–18, followed by Boston at 61–21. Those records describe the 82-game regular season; the 2025 Play-In subsequently decided the final two playoff seeds in each conference.
The complete historical tables below retain every team's final regular-season rank and show its eventual playoff seed separately. This distinction matters most for Miami, which finished tenth in the East and entered the playoffs as the eighth seed.
Final 2024–25 NBA standings for all 30 teams
The regular season ran from October 22, 2024, through April 13, 2025, as specified in the NBA's schedule announcement. Each team completed 82 games. Wins and losses below exclude the Play-In and playoff series. A playoff seed shown in the final column reflects the bracket after the Play-In, rather than an extra regular-season victory.
Records and conference order were checked against the official 2025 Cavaliers playoff guide. The NBA's final bracket report establishes the postseason field. A dash in the seed column means the team did not reach the 16-team playoffs, including teams eliminated in the Play-In.
Eastern Conference final records
| Rank | Team | W | L | Pct. | Playoff seed |
|---|---|---|---|---|---|
| 1 | Cleveland Cavaliers | 64 | 18 | .780 | 1 |
| 2 | Boston Celtics | 61 | 21 | .744 | 2 |
| 3 | New York Knicks | 51 | 31 | .622 | 3 |
| 4 | Indiana Pacers | 50 | 32 | .610 | 4 |
| 5 | Milwaukee Bucks | 48 | 34 | .585 | 5 |
| 6 | Detroit Pistons | 44 | 38 | .537 | 6 |
| 7 | Orlando Magic | 41 | 41 | .500 | 7 |
| 8 | Atlanta Hawks | 40 | 42 | .488 | — |
| 9 | Chicago Bulls | 39 | 43 | .476 | — |
| 10 | Miami Heat | 37 | 45 | .451 | 8 |
| 11 | Toronto Raptors | 30 | 52 | .366 | — |
| 12 | Brooklyn Nets | 26 | 56 | .317 | — |
| 13 | Philadelphia 76ers | 24 | 58 | .293 | — |
| 14 | Charlotte Hornets | 19 | 63 | .232 | — |
| 15 | Washington Wizards | 18 | 64 | .220 | — |
The East had a clear direct-entry cutoff: Detroit's 44 wins secured sixth, three ahead of seventh-place Orlando. Orlando's .500 record still earned the first Play-In hosting position. Atlanta, Chicago and Miami then occupied the remaining Play-In places. Toronto finished seven wins behind Miami and outside that competition altogether. These are separate thresholds, so calling every top-10 finish a playoff berth would overstate what the standings awarded.
None of the East's 15 teams finished tied on overall record. That makes the order straightforward to read, even though the later playoff field differs. Cleveland's 64 wins were 20 more than Detroit's sixth-place total and 27 more than Miami's tenth-place total. Those gaps show why qualification and championship expectation should be treated as different questions.
Western Conference final records
| Rank | Team | W | L | Pct. | Playoff seed |
|---|---|---|---|---|---|
| 1 | Oklahoma City Thunder | 68 | 14 | .829 | 1 |
| 2 | Houston Rockets | 52 | 30 | .634 | 2 |
| 3 | Los Angeles Lakers | 50 | 32 | .610 | 3 |
| 4 | Denver Nuggets | 50 | 32 | .610 | 4 |
| 5 | LA Clippers | 50 | 32 | .610 | 5 |
| 6 | Minnesota Timberwolves | 49 | 33 | .598 | 6 |
| 7 | Golden State Warriors | 48 | 34 | .585 | 7 |
| 8 | Memphis Grizzlies | 48 | 34 | .585 | 8 |
| 9 | Sacramento Kings | 40 | 42 | .488 | — |
| 10 | Dallas Mavericks | 39 | 43 | .476 | — |
| 11 | Phoenix Suns | 36 | 46 | .439 | — |
| 12 | Portland Trail Blazers | 36 | 46 | .439 | — |
| 13 | San Antonio Spurs | 34 | 48 | .415 | — |
| 14 | New Orleans Pelicans | 21 | 61 | .256 | — |
| 15 | Utah Jazz | 17 | 65 | .207 | — |
The West's shape was markedly different. Oklahoma City's 16-win margin over Houston was larger than Houston's 13-win margin over tenth-place Dallas. Behind the leader, a relatively compact group competed for sharply different postseason positions. Third through eighth were separated by only two wins, and three teams shared the 50–32 record. The conference rank column therefore preserves the resolved tiebreak order rather than alphabetizing equal records.
The two conferences each contain 15 teams, and every row sums to 82 games. Across all 30 teams there were 1,230 wins and 1,230 losses, corresponding to 1,230 regular-season games. That arithmetic is a useful archive check: adding Play-In results to these records would spoil the totals and blur the boundary between the regular season and postseason qualification.
Cleveland and Boston separated themselves in the East
Cleveland and Boston occupied a tier of their own in the final East table. The Cavaliers finished three wins ahead of the Celtics, while Boston finished ten ahead of New York. The difference between second and third was therefore much larger than the difference between first and second. Reading only the seed numbers conceals that separation: consecutive positions need not represent similarly close regular seasons.
Cleveland won 78.0% of its games and Boston won 74.4%. Both comfortably exceeded the 60-win threshold, yet only one could enter the East bracket as its top seed. The Cavaliers secured that position and began against the eighth seed; Boston began against the seventh. Their sustained regular-season work created favorable starting positions without deciding what would happen once opponents could prepare for a repeated matchup.
The leading pair also reached those totals through different location profiles. The official home-and-away records show Cleveland at 34–7 at home and 30–11 away. Boston went 28–13 at home and 33–8 away. Across their respective 41-game splits, Cleveland won 82.9% at home, while Boston won 80.5% on the road. Cleveland's six additional home wins more than offset Boston's three additional road wins, producing the three-win overall gap. Boston therefore had the stronger road record despite finishing second. That is a useful distinction when discussing home-court advantage: the standings awarded it through overall results, while the location splits describe how those results accumulated. Neither split alone predicts a playoff series or identifies why individual games were won.
The middle of the direct-entry group was more compressed. New York's 51 wins put it one above Indiana, and Indiana's 50 put it two above Milwaukee. The Pacers' official playoff guide records their fourth-place finish and home-court position against the Bucks. That fourth-versus-fifth line made the location of a potential deciding game meaningful even though only two regular-season wins separated the teams.
Detroit completed the six-team automatic group at 44–38. The Pistons were four wins behind Milwaukee and three above Orlando, so their final position avoided the uncertainty facing the next four teams. A sixth-place finish had a concrete competitive benefit: Detroit could prepare for a first-round series instead of first needing to secure a berth through a short qualification event.
The lower half also deserves attention when interpreting “last season's standings.” Atlanta's 40 wins were enough for eighth in the regular table, but Chicago and Miami remained close enough to enter the Play-In. Toronto's 30 wins left a substantially larger gap. A team could be close to eighth while still below .500, and another could improve its position within the bottom five without approaching postseason qualification.
These comparisons explain the East's overall shape more accurately than a single label such as competitive or weak. There was a strong leading pair, a distinct direct-entry group and a separate battle for the final postseason opportunities. They also establish a useful boundary for historical arguments: a later upset does not erase the leading teams' season-long advantage, just as a high seed does not make an upset impossible.
The West's tied records made every seed consequential
Oklahoma City's lead should not obscure the pressure behind it. Houston's 52 wins secured second, but the next six teams finished between 48 and 50 wins. Within that narrow range, the rewards included home-court advantage, direct playoff entry and merely the chance to qualify through the Play-In. Equal records also required a resolved order, which is why historical tables need more than a descending wins column.
Three 50-win teams occupied seeds three through five
The Lakers, Nuggets and Clippers each finished 50–32. Their final order was Los Angeles third, Denver fourth and the Clippers fifth. The official season win grid lets readers inspect the results behind that tie: the Lakers combined for a 5–3 record against the other two teams, Denver went 4–4 and the Clippers went 3–5.
That order produced two different opening assignments. The Lakers faced sixth-seeded Minnesota. Denver and the Clippers faced each other, with Denver holding the higher seed and home court. The identical overall records did not mean those clubs could be freely interchanged in the bracket. Nor should a later draft-related tiebreak draw be substituted for the conference order; those procedures answer different questions.
A useful way to discuss this race is to separate record from position. All three delivered the same number of regular-season wins. The tiebreak rules then translated their particular results into an ordered bracket. Calling one the fourth-best team solely because it ranked fourth would turn a qualification procedure into a stronger basketball judgment than the evidence supports.
The 48-win line divided direct entry from the Play-In
Minnesota finished 49–33 and took sixth. Golden State and Memphis finished 48–34, one win behind the Timberwolves, and entered the Play-In seventh and eighth respectively. Golden State held the season-series advantage against Memphis. Its official final-week postseason update documented that head-to-head advantage before the finale.
The last day supplied a direct illustration of the stakes: the Clippers beat Golden State 124–119 in overtime on April 13. The NBA gamebook fixes that result to the regular season. Golden State then had to earn its playoff place in an additional event. This is why a single loss in a crowded table can matter more than the small change in winning percentage suggests.
Below Memphis, Sacramento and Dallas finished 40–42 and 39–43. Their route was harder: the ninth-versus-tenth game was elimination, followed by another necessary win. Phoenix and Portland both finished 36–46 and missed even that opportunity. A standings archive should preserve these layers rather than simply dividing the West into eventual playoff teams and everyone else.

How the 2025 Play-In changed the playoff field
The Play-In ran from April 15 through April 18. Its purpose was to assign seeds seven and eight in each conference. The seventh- and eighth-place teams began with two chances to qualify; the ninth- and tenth-place teams needed two wins and could not lose. That asymmetry rewarded the higher regular-season finish without guaranteeing either team a place in the playoffs.
| Date | East result | West result |
|---|---|---|
| April 15, 2025 | Orlando 120, Atlanta 90 | Golden State 121, Memphis 116 |
| April 16, 2025 | Miami 109, Chicago 90 | Dallas 120, Sacramento 106 |
| April 18, 2025 | Miami 123, Atlanta 114 (OT) | Memphis 120, Dallas 106 |
Orlando and Golden State used the first opportunity to secure the seventh seeds. Atlanta and Memphis retained a second opportunity after losing. The following night, Miami eliminated Chicago and Dallas eliminated Sacramento. The final games then paired each surviving ninth-or-tenth-place team with the loser from the seventh-versus-eighth game.
Miami supplied the major change between the regular standings and the playoff bracket. The Heat finished 37–45, behind both Chicago and Atlanta, but won two road elimination games. Their overtime victory in Atlanta made them the East's eighth playoff seed. The official Atlanta gamebook records the 123–114 result. Atlanta's higher regular-season finish had provided a second chance, but it could not carry the Hawks through two losses.
Memphis took the West's eighth seed by beating Dallas 120–106. The Grizzlies therefore preserved the same numerical position they held in the regular standings, although they needed the second qualifying game to do it. Dallas advanced one step by beating Sacramento and then stopped short. The Memphis gamebook and the NBA's official game highlights document the deciding night.
The resulting first-round assignments were Cleveland–Miami, Boston–Orlando, Houston–Golden State and Oklahoma City–Memphis. Miami did not become the eighth-best regular-season team, and Atlanta did not retroactively drop below Chicago in the 82-game table. The event assigned bracket places using its own results. Keeping that distinction clear resolves the apparent contradiction when one archive lists Miami tenth and another lists it eighth.
It also explains why a ninth- or tenth-place finish is an opportunity with a substantial condition attached. The route is available, as Miami demonstrated, but requires surviving consecutive elimination games before beginning a best-of-seven series against a conference leader.
What the final standings explain about the 2025 playoffs
A regular-season table is a record of a long competition and a mechanism for assigning postseason opportunities. It is not a forecast that becomes incorrect whenever a lower seed wins. The 2025 playoffs supplied both confirmation and disruption: the team with the league's best record won the championship, while the East's fourth seed outlasted the three teams above it.
Home-court advantage is one tangible link between the two competitions. Higher positioning determines the favorable home schedule within the applicable series rules. It does not award points before tipoff, remove matchup problems or preserve a team's health. When comparing seasons, keep that distinction between an earned structural advantage and a guaranteed result.
Oklahoma City's record and Indiana's different route
Oklahoma City's 68 wins and Indiana's 50 created an 18-win regular-season gap between the eventual finalists. The Thunder won approximately 82.9% of their games; the Pacers won approximately 61.0%. The Finals nevertheless required seven games. Oklahoma City won Game 7, 103–91, on June 22 and took the series 4–3, as recorded in the official 2025 series archive.
Indiana's route shows why the conference table should be read alongside the bracket. The Pacers beat fifth-seeded Milwaukee 4–1, first-seeded Cleveland 4–1 and third-seeded New York 4–2. Their official Finals guide documents the path to the championship round. They did not finish above those opponents in the regular table; they beat the opponents assigned to their postseason path.
That distinction also keeps Boston's place in the story accurate. The Celtics finished second in the East, but Indiana did not have to defeat every higher-ranked team directly to become conference champion. A bracket eliminates teams through particular matchups. Saying the Pacers “went through the East's top three” would suggest three direct series that did not occur.
For Oklahoma City, the championship added a separate accomplishment to the 68–14 record. Those 68 wins stay in the regular-season archive; the playoff wins belong to the title run. Combining both into one larger win total can describe a complete campaign if clearly labeled, but it should never replace the regular-season row when comparing standings.
Use this archive when checking the final 2024–25 order, the direct-entry cutoff or the origin of the 2025 playoff seeds. Use the current NBA games page and this week's NBA schedule for present fixtures. Keeping the season label, competition stage and rank definition visible makes both historical comparisons and everyday fan discussions much more precise.

Sign in with Google to join the discussion.