Lock the correct date and confirm every game is final
“Yesterday” begins with your clock, not with an NBA logo. A 10:30 p.m. Pacific tip can finish after midnight in New York and during the following morning in Europe or Asia. Open the daily NBA games board, move back one date in the viewer zone, and keep the U.S. arena date visible as the shared reference. That prevents a late game from appearing missing when it is filed under a neighboring date.
Next, read the status before the score. Final means regulation ended. Final/OT or 2OT tells you extra periods affected minutes, totals, and fatigue. A postponed or suspended row is not a 0-0 result, a forfeit, or evidence that the feed failed. It requires a schedule notice and, eventually, a rescheduled date.
Date
Viewer-local day plus arena date
State
Final, OT, postponed, or rescheduled
Record
Official final score and box score
Context
Recap, play-by-play, and video
Use the official game page as the record layer. Search snippets and social posts are discovery tools; they can preserve a third-quarter score or crop away the overtime label. Confirm both teams, home/away order, total, and period status before sharing a result. A one-point final and a one-point halftime lead are entirely different facts.
Finally, allow for correction without distrusting the result. The winner and final score normally settle at the horn, while individual assists, rebounds, steals, blocks, or turnovers can receive later review. If a fantasy result, prop, record, or historical claim depends on one credited statistic, return to the updated official box score. Verification is not pedantry—it is the line between a recap and a rumor.
Read the team box score in layers, not left to right
Start with possessions, even if you only estimate them. A 125-120 game played at extreme pace can contain less efficient offense than a 110-106 game with fewer trips. Offensive rating normalizes points to 100 possessions; pace estimates possessions per 48 minutes. That separates “scored a lot” from “scored efficiently” and stops era or style from swallowing the analysis.
Then use the Four Factors as a diagnostic: effective field-goal percentage gives extra weight to made threes, turnover rate measures lost opportunities, offensive-rebound percentage measures available misses recovered, and free-throw attempt rate compares foul shots with field-goal attempts. Do not count the offensive rebound as a brand-new possession—the NBA glossary treats it as an extension of the same one.
| Layer | Question | Basketball translation |
|---|---|---|
| Efficiency | Who created more value per possession? | Shot quality/making, threes, and free throws |
| Possession battle | Who generated more chances? | Turnovers and second-shot opportunities |
| Location | Where did scoring come from? | Rim, paint, midrange, arc, and line |
Only after the team layer should you inspect categories such as paint points, fast-break points, points off turnovers, bench scoring, and assists. They describe mechanisms but can overlap. A steal leading to a transition layup can count as both points off turnovers and fast-break points, so adding those columns creates a fictional total.
End with the opponent comparison. Fifteen turnovers are not automatically disastrous if the other team commits 20, and 12 offensive rebounds mean different things against 25 misses than against 50. The box score is relational. Identify the two largest edges, check whether they survive possession adjustment, and frame them as explanations for this game—not permanent traits discovered in one night.
Reconstruct game flow before assigning a cause
A final margin deletes sequence. It cannot tell you whether the winner controlled the night, survived a collapse, or trailed until the last touch. Open the quarter scores and lead tracker first. Mark the largest lead, the last tie, the first durable change of control, and any overtime. Then use play-by-play to turn those shapes into possessions.
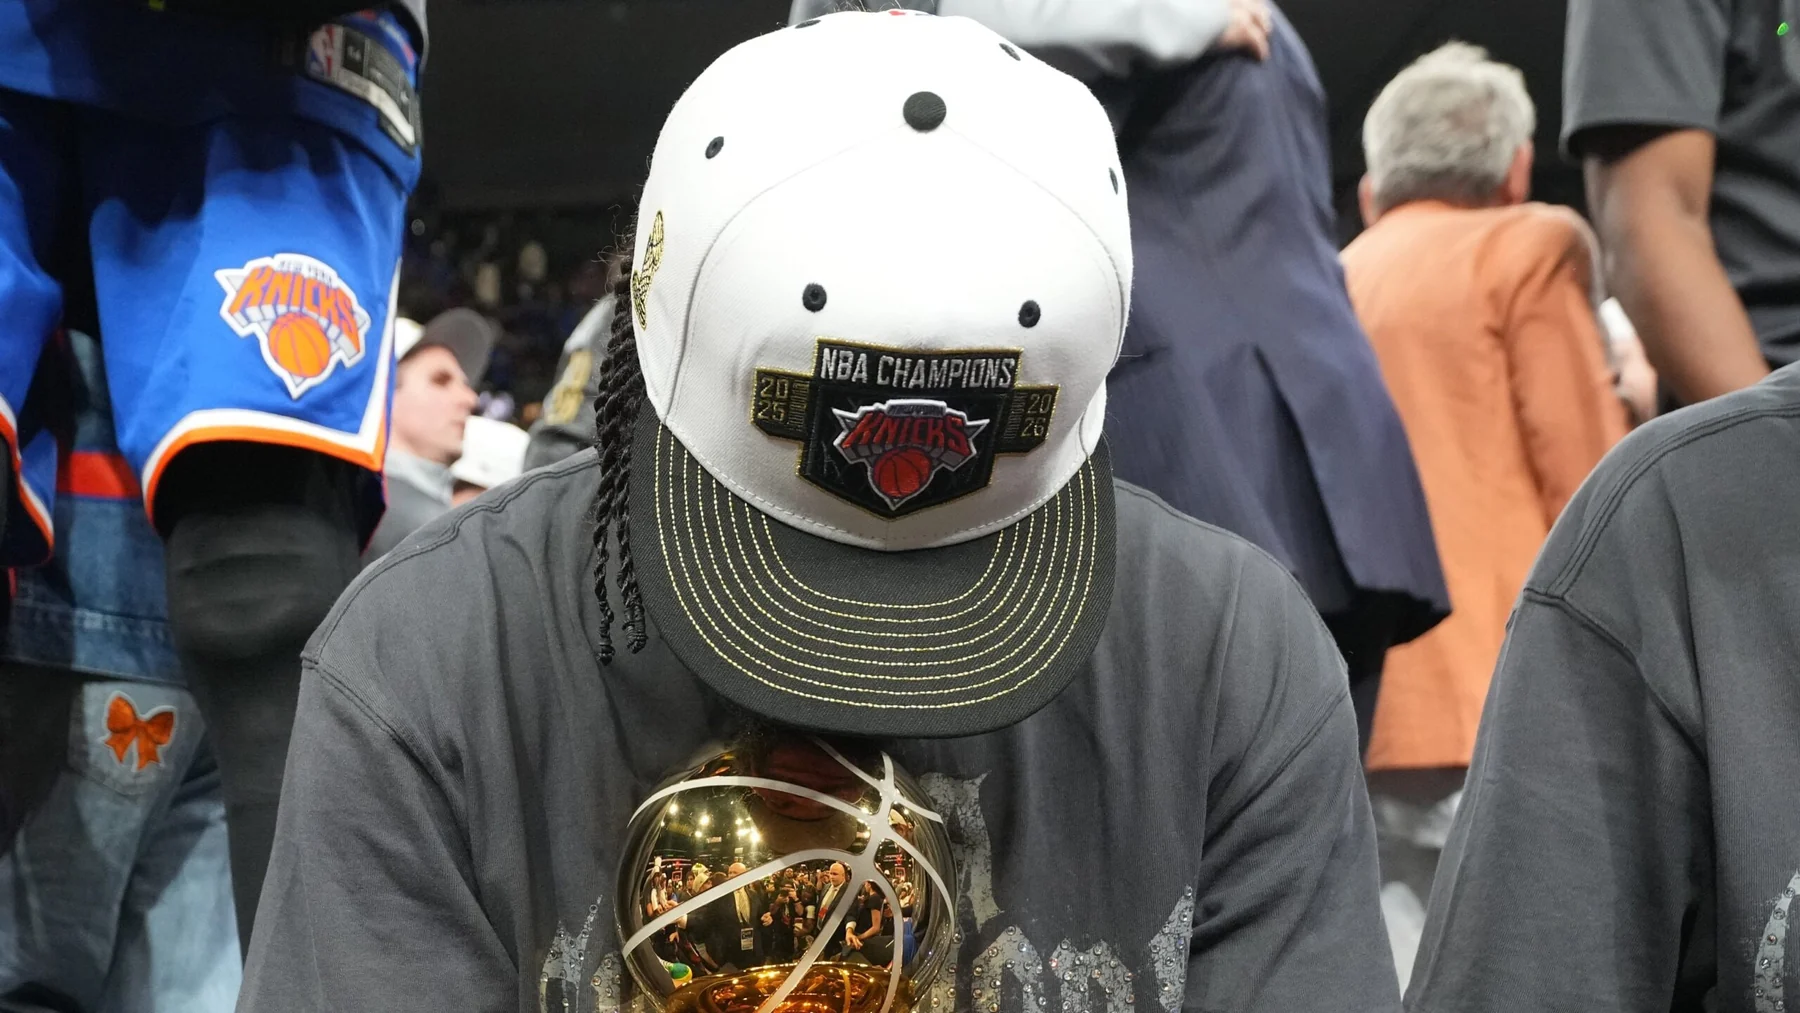
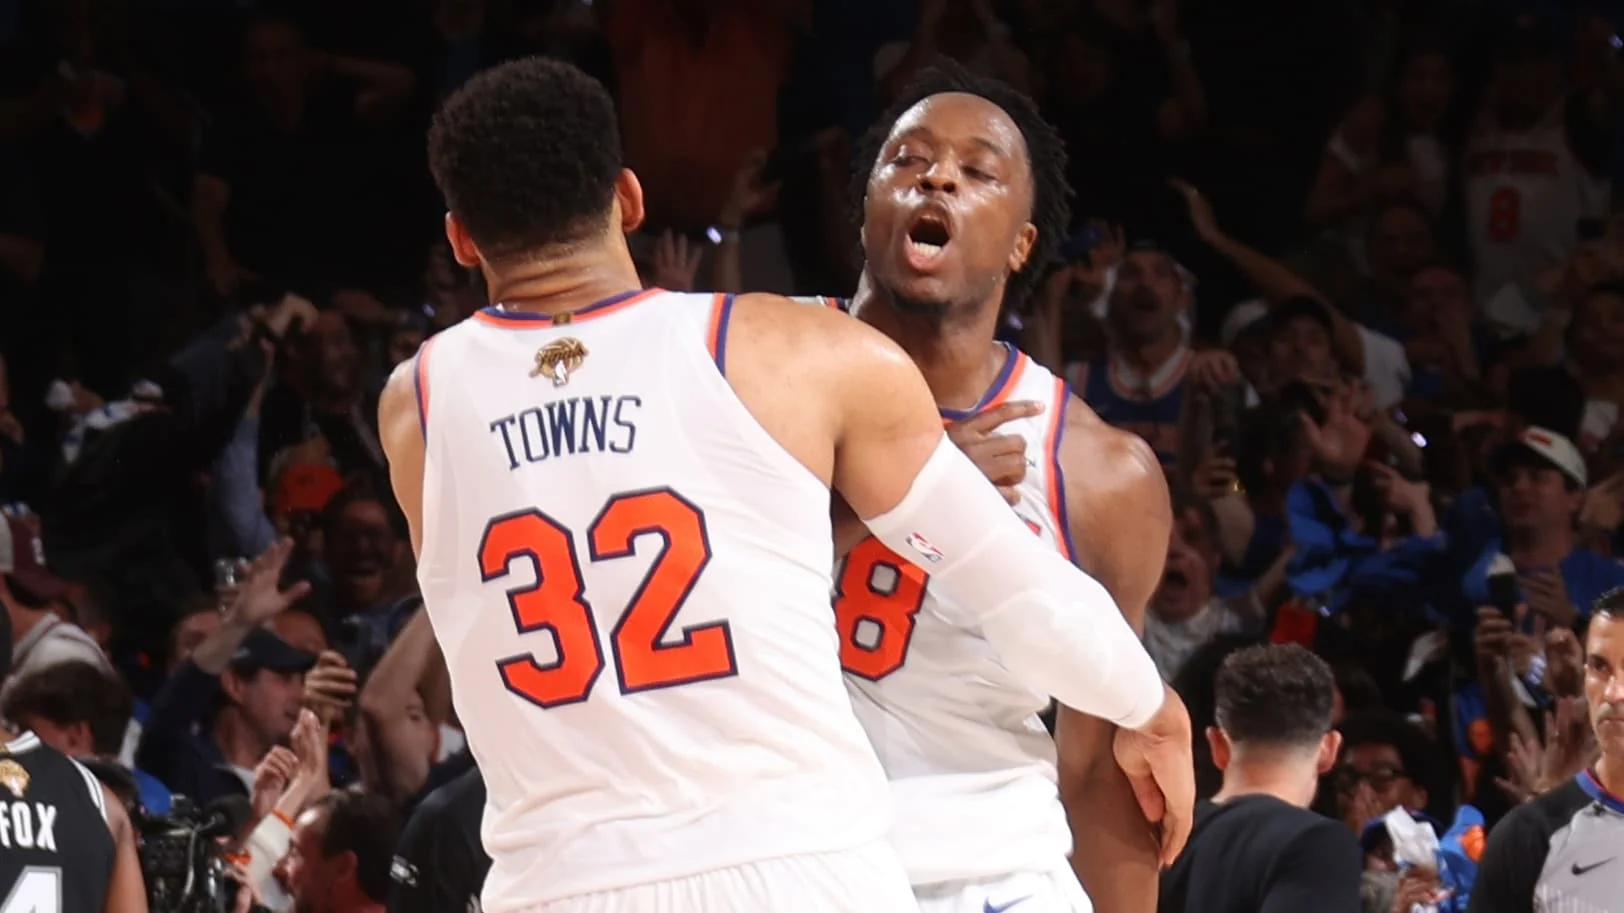
The 2026 Finals supplied an extreme lesson. San Antonio led New York 81-52 with 9:40 left in the third quarter of Game 4. The Knicks closed the final 21½ minutes 55-25 and won 107-106, despite never leading by more than one. The final score looks like an evenly traded one-point game; the timeline reveals domination, counterpunch, and a historic reversal.
Find two or three decisive stretches, not a highlight montage. For each, note the lineups, turnovers, offensive rebounds, shot locations, and whether the points came in transition or against a set defense. If a 12-0 run includes four live-ball turnovers, the mechanism is clearer than “wanted it more.” If it includes three contested threes, shooting variance deserves more weight.
Clutch data is another layer, not the whole story. The NBA defines clutch time as the final five minutes of the fourth quarter or overtime when the score is within five. That standard makes comparisons consistent, but a team can create the decisive advantage in the third quarter or enter the final five already safe. Do not erase 43 minutes because the last five have a branded filter.
Finally, separate the winning play from the cause of victory. A putback, block, or buzzer-beater resolves the last possession; it rarely explains all prior conditions. Ask what created the opportunity, which coverage forced the first shot, and why the rebounder was free. Strong recaps connect the final frame to the game’s earlier problems instead of treating one spectacular image as a complete theory.
Put player stat lines in role and efficiency context
Read minutes before points. Forty points in 44 minutes of overtime basketball describes a different workload from 28 points in 24 minutes of a blowout. Then inspect field-goal attempts, threes, free throws, turnovers, and true shooting percentage. True shooting combines the value of twos, threes, and free throws, making it a better scoring-efficiency summary than field-goal percentage alone.
Next, ask what the player was responsible for. Usage percentage estimates the share of team plays a player ends through a shot, possession-ending free throws, or turnover while on court. It does not count every pass that bends the defense or every screen that frees a teammate. High usage can signal heavy creation burden, and the NBA’s own role analysis notes that efficiency often faces pressure when that burden rises.
A disciplined reading order
- 1. Opportunity: minutes, starts, shots, touches, and usage.
- 2. Efficiency: true shooting, turnovers, assists, and shot profile.
- 3. Role: primary creator, spacer, roller, rebounder, or stopper.
- 4. Context: opponent scheme, lineup partners, score state, and overtime.
Treat plus-minus as a prompt. It records the team’s point differential during a player’s minutes, not an isolated grade for that player. A reserve can post +12 because a bench group hits five threes; a starter can finish -8 after sharing every minute with an injured lineup against the opponent’s best unit. Watch the relevant shift or compare lineup combinations before assigning individual credit.
Defense is the box score’s blind spot. Steals and blocks are events, not complete coverage. A wing can deter passes, switch across positions, or force the ball away without receiving a traditional stat. Conversely, two steals do not erase repeated breakdowns. Use matchup film, shot locations, and team defense during the minutes as supporting evidence, while resisting the temptation to turn one clip into a full-night verdict.
Finally, compare the line with the player’s own role rather than a universal superstar template. Ten points on five shots may be excellent for a low-usage defender; ten points on 18 shots is a problem for a lead scorer. Yesterday gives a performance sample. Season trends, lineup samples, and repeated tactical patterns decide whether it is a signal.
Choose between highlights, condensed games, and full replays
Pick the video format by the question you want answered. A highlight package is the fastest route to the biggest makes, blocks, dunks, and late possessions, but its selection is the story. It removes empty trips, failed actions, defensive possessions without a box-score event, and most lineup transitions. Use highlights to see spectacular moments, not to prove that one player controlled every minute.
An official game recap adds a narrative spine and usually enough sequence to understand major runs. A nightly recap is useful when you missed an entire slate and want to decide which games merit deeper attention. A condensed game preserves more possessions and game flow, while a commercial-free full replay is the best choice for studying coverages, substitution patterns, and off-ball work. More minutes generally buy more context.
| Format | Best use | What it can hide |
|---|---|---|
| Highlights | Signature plays and a quick result | Empty possessions, rotations, and setup |
| Game recap | Main swings in a few minutes | Long tactical stretches and subtle defense |
| Condensed game | Possession sequence on limited time | Dead-ball adjustments and broadcast analysis |
| Full replay | Film study and complete game texture | Little, although broadcast framing still selects views |
If you are avoiding the score, switch on Hide Scores before opening NBA.com or the NBA App. The NBA warns that home-page headlines and images can still spoil a result, so enter through the Games page or a saved game link rather than browsing news first. Also silence team notifications and social feeds; an app setting cannot hide a celebratory push alert from somewhere else.
Do not mistake “final” for “replay ready.” League Pass editing and platform uploads can take several hours. In the United States, the NBA says national-TV full replays become available at 6 a.m. ET the next day, while local-TV full replays can remain unavailable for 72 hours because of blackout rules. Those windows, subscriptions, and territory rights can change what each viewer sees.
A practical order is simple: confirm the result only if spoilers are acceptable, watch the recap to locate the turning points, and graduate to condensed or full footage when a claim depends on possessions the edit omitted. Video should test the theory you formed from the box score and play-by-play. It should not merely decorate the theory with the loudest available clip.
Carry yesterday’s result into standings and the next game
A final score becomes useful again when you place it in the season. Update the win-loss record, games back, conference record, streak, and relevant season series, then check the official standings rather than assuming the table moves one position. A win can leave a team in the same seed because the teams above it also won; a loss can be costly even when the visible rank does not change.
Near a standings tie, learn the order before declaring that one team “owns” the seed. For two teams, the NBA first compares head-to-head winning percentage, then division-winner status, followed by division percentage when applicable and conference percentage. Multi-team ties use a different opening sequence. The standings page applies the complete procedure; a fan’s simple head-to-head shortcut may fail as teams enter or leave a three-way tie.
Record layer
W-L, games back, conference record, season series, and Play-In line.
Workload layer
Minutes, overtime, travel, back-to-back status, and rotation depth.
Next-game layer
Opponent, venue, tip time, broadcast, and latest availability.
Now open the team schedule directory and locate the next game. Record whether it is home or road, the travel path, the rest interval, and whether the opponent rested longer. If yesterday went to overtime, add five minutes for each extra period to the workload picture. That creates a question about recovery; it does not establish that players will be tired or unavailable.
Availability must come from a fresh report. NBA teams report affected players the day before most games, but the second game of a back-to-back has a later game-day deadline. Reports continue to update. A star who played 43 minutes yesterday is not automatically resting tomorrow, and a player absent yesterday is not automatically out again. Treat the official designation and subsequent update as evidence, not your fatigue model.
Separate result, explanation, and forecast in your notes. “Won by controlling turnovers” describes yesterday. “Moved into sixth after the tiebreak was applied” describes the standings consequence. “Should win next because momentum” is a forecast requiring opponent, availability, rest, and matchup evidence. Keeping those claims apart protects good postgame analysis from turning into a confident but unsupported prediction.
Finish by following the slate forward through the 2026-27 NBA schedule. Confirm the next tip in your local zone on game day, recheck the channel, and reopen the injury report. Yesterday’s game is not an isolated archive entry; read correctly, it is the first piece of context for the next one.
Sign in with Google to join the discussion.