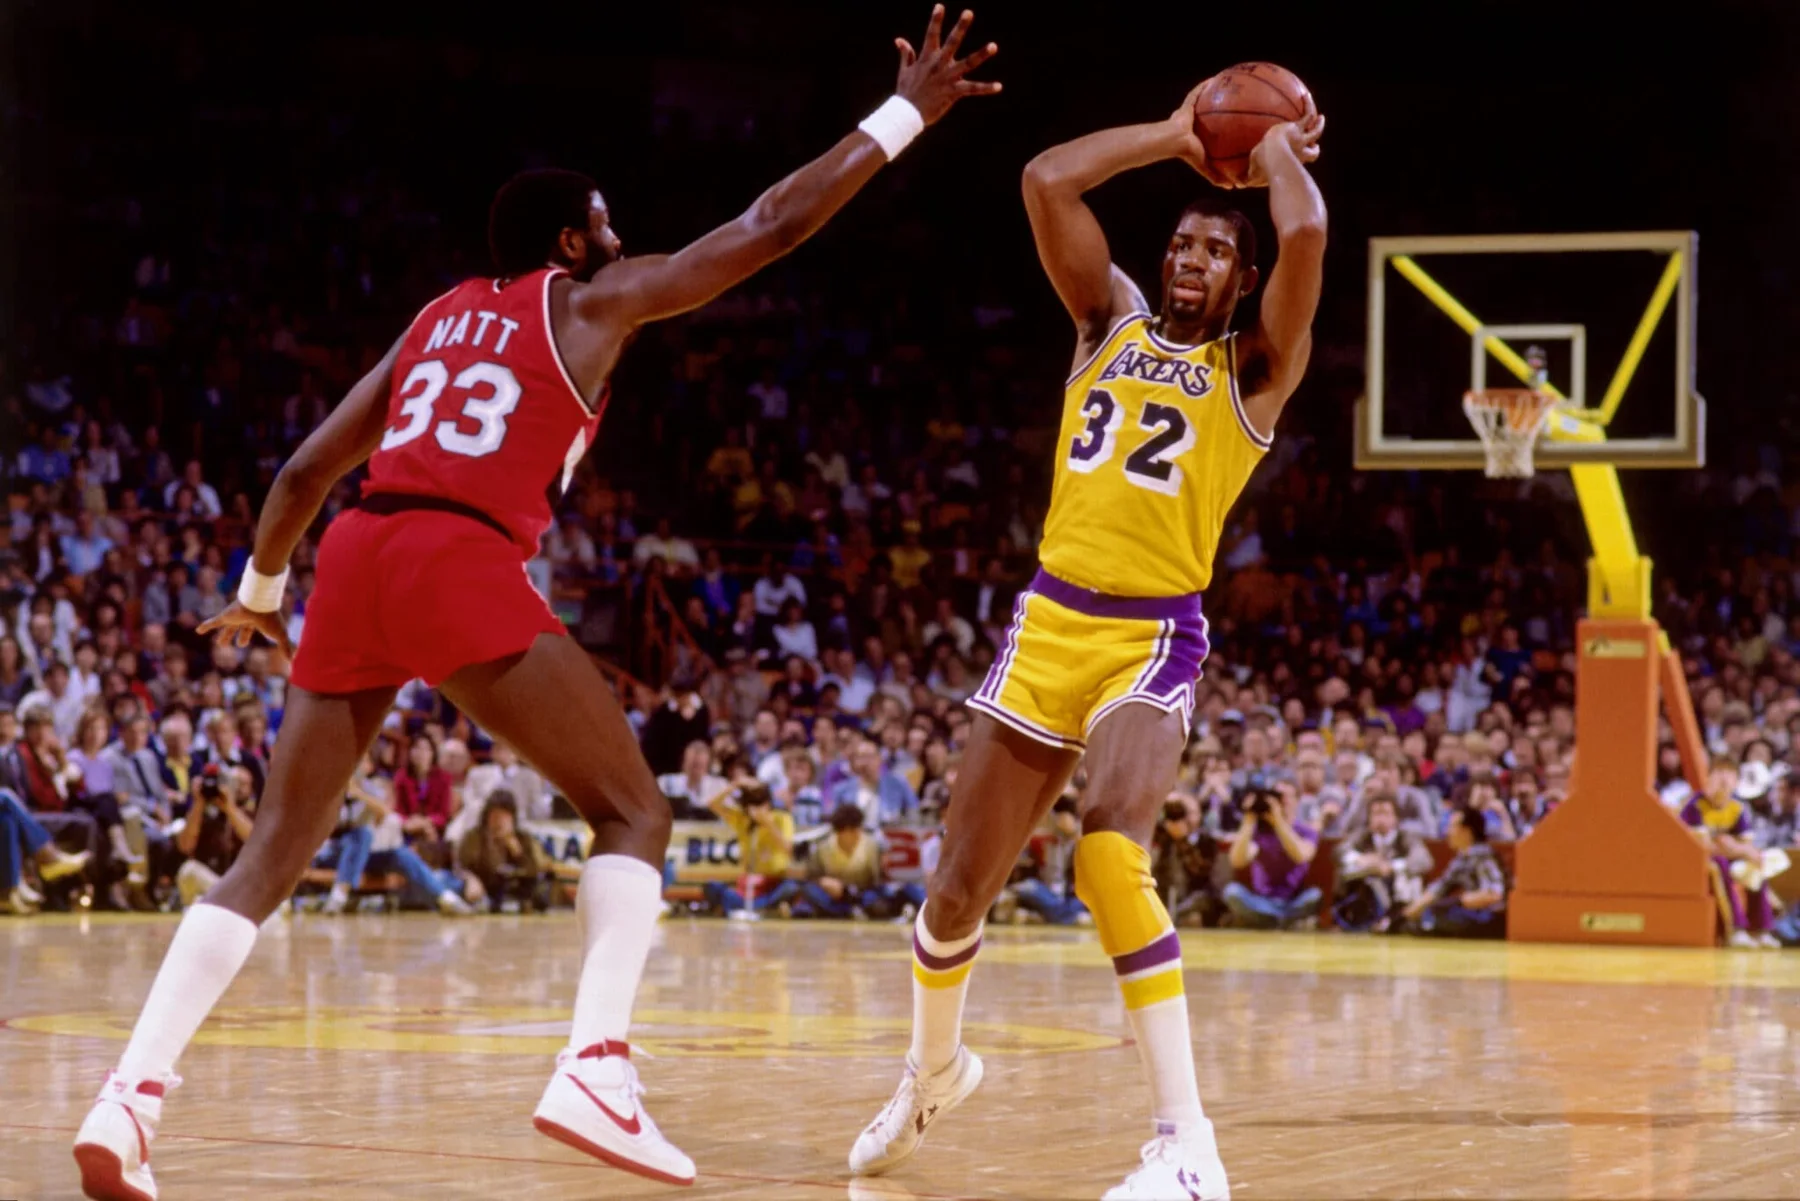
Magic Johnson leads with a 500-game minimum
Magic Johnson has the highest NBA career regular-season winning percentage among players with at least 500 appearances: 74.0 percent, rounded to one decimal place. His record was 670 wins and 236 losses in 906 games, equivalent to 73.95 percent at two decimals. The leaderboard was checked on October 19, 2026, after the completed 2025-26 season.
The minimum matters as much as the name. This is a comparison of substantial NBA careers, using a disclosed 500-game filter. It is not a claim that no player has ever won a higher fraction over a shorter sample, and it is not an official NBA award qualification rule. Remove the filter and brief careers with perfect or nearly perfect records can crowd the top.
The calculation is wins divided by games played, multiplied by one hundred. For Johnson, 670 divided by 906 produces approximately 0.739514. A table displaying a three-decimal proportion shows .740; a percentage table rounded to one decimal shows 74.0 percent. Those formats describe the same record. Rounded numbers should not be treated as if the underlying fraction were exactly three quarters.
Winning percentage answers how often a player's NBA appearances ended in a team victory. It does not tell us how often he was available, how much of each game he played or how many wins he personally created. A coach's record is another separate subject, even when the same former player later coaches an NBA team.
Nor is percentage the same as total victories. A much longer career can accumulate more wins while carrying a lower proportion. Our NBA career wins leaderboard covers that cumulative record. The distinction explains why two articles can identify different kinds of “winningest” player without either needing to change its data.
The strongest way to use Johnson's record is therefore precise: among players who cleared this substantial regular-season appearance threshold, no one in the checked leaderboard won more frequently. That is an extraordinary record of sustained team success. Explaining the threshold, denominator and competitive setting makes the achievement clearer than dropping those qualifications to create a broader but less defensible superlative.
The minimum-games rule changes the answer
A minimum creates an eligible population. Five hundred games represents substantial NBA participation, roughly six full 82-game schedules, although an actual career can take much longer to reach it. The filter removes tiny perfect records while retaining many historically important careers that never reached a thousand appearances.
Use appearances as the denominator
Count only games in which the player entered. An injury absence does not become a loss because his team lost, and a team victory during his absence does not improve his rate. The denominator belongs to the player. This also means career winning percentage is not an availability metric: a player can miss many games and still win a high share of the ones he plays.
A hypothetical player going 8-2 has an 80 percent rate, but his ten-game sample says much less about sustained NBA success than a record containing hundreds of games. Even at 500 appearances, the total does not reveal his minutes, opposition or responsibility. A minimum improves the comparison's relevance without curing every limitation.
Do not substitute games started or seasons on a roster. A productive reserve can enter hundreds of winning games without starting, while a starter can miss part of a season. Likewise, do not average season percentages equally. A ten-game season and an eighty-game season must contribute according to their actual appearances. Add wins and losses first, then calculate the career fraction.
At 1,000 games, Manu Ginobili moves to the top
Raise the regular-season threshold to 1,000 appearances and the answer changes to Manu Ginobili: 762 wins in 1,057 games, or 72.09 percent. Guinness World Records recognizes his 72.1 percent record in that category, and the NBA's career retrospective documents the same 762-295 record.
Johnson's 906 appearances and Larry Bird's 897 do not satisfy that higher minimum. They have not been surpassed on percentage by the act of changing the filter; they have become ineligible for a different comparison. Saying Ginobili leads with 1,000 games and Johnson leads with 500 games preserves both achievements.
The threshold should therefore appear wherever the conclusion appears: in the table label, headline context or sentence announcing the leader. Removing it from a social graphic makes a conditional record sound universal. Readers should be able to reproduce the population being ranked before deciding what basketball meaning to attach to the result.
Nine retired leaders in NBA career winning percentage
This retired-player reference lists nine leading completed careers with at least 500 NBA regular-season appearances. Percentages are rounded to one decimal place. It isolates stable historical records rather than presenting an incomplete table as a live ranking of every active player. Games played remain visible so that the rate and its sample can be assessed together.
| Retired-player rank | Player | Regular-season appearances | Winning percentage |
|---|---|---|---|
| 1 | Magic Johnson | 906 | 74.0% |
| 2 | Larry Bird | 897 | 73.6% |
| 3 | K.C. Jones | 676 | 73.1% |
| 4 | Michael Cooper | 873 | 72.9% |
| 5 | Tom Heinsohn | 654 | 72.6% |
| 6 | Manu Ginobili | 1,057 | 72.1% |
| 7 | Tim Duncan | 1,392 | 71.9% |
| 8 | Sam Jones | 871 | 71.8% |
| 9 | Bill Russell | 963 | 71.7% |
Bird's second place comes from a 660-237 regular-season record, producing 73.58 percent before rounding. Comparing that with Johnson's 73.95 shows how narrow the gap is at the top. It is approximately 0.37 percentage points, not a declaration that Johnson was a specified percentage better at basketball.
Duncan's much larger denominator stands out as well. Maintaining a high rate over 1,392 appearances is a different career shape from doing so over fewer than seven hundred. The percentage still determines this ordering, but the sample explains why a reader might attach additional significance to longevity without changing the statistical rank.

The table also illustrates why a scoring-only view misses part of winning basketball. It contains lead creators, interior defenders and players remembered for complementary roles. Their common statistical result does not make their assignments identical. A winning team needs several types of contribution, and this measure observes the shared outcome rather than separating the jobs that produced it.
Finally, avoid manufacturing precision from the displayed percentage. Multiplying 73.1 percent by 676 does not guarantee an integer equal to K.C. Jones's exact win count, because the rate has been rounded. Reconstructing a W-L record requires the original wins and losses. That is also why close ranks should be sorted from full records rather than from a screenshot containing only one decimal.
Why successful dynasties dominate the list
The leading retired names repeatedly return to the Lakers, Celtics and Spurs. That clustering is a clue about what the measure observes. When a core stays together on a successful team, its members participate in many of the same victories. Their rates are related records built from overlapping games, rather than independent experiments measuring each player's isolated effect.
That does not make the accomplishment empty. Remaining useful on a contender requires skills that survive changing opponents and a crowded rotation. A player who cannot defend the required matchup or execute the offense can lose minutes even when his team is excellent. Sustaining a role is part of the record, although the fraction does not reveal how difficult the role was.
A role player's rate does not measure a superstar's responsibility
Cooper was valued for defense and often worked as a sixth man. K.C. Jones also supplied defensive value for Boston. These are concrete reminders that a team can win through contributions that do not resemble a lead scorer's box score. Stopping a dangerous guard or fitting beside an offensive hub helps a lineup function.
Ginobili, the 2007-08 Sixth Man of the Year, offers a different reserve example. A bench role can carry substantial creation responsibility. Starting status does not tell us who initiates the offense when a first unit rests, who attacks a shifting defense or who finishes a close game. A percentage table treats those responsibilities alike once the final result is recorded.

Equally, a superstar who joins a weak roster may spend years building toward contention. Those losses remain part of his percentage even if his individual performance is excellent. Someone entering a settled contender can enjoy a more favorable early environment. Neither situation can be converted into a precise personal value estimate by looking only at W and L.
The fair reading avoids both extremes. A high rate is not proof that a role player was individually better than a superstar below him, and a strong supporting cast does not erase useful contributions. It is evidence of a successful player-team relationship. Our comparison of great NBA teams explores those environments, while this list keeps the career rate and its limits visible.
Keep regular-season and playoff percentages separate
The main answer here concerns the regular season. A playoff percentage uses only playoff appearances and requires its own minimum-games rule. It should not inherit the regular-season leader automatically. A player may have a lower postseason percentage because the field contains stronger opposition and repeated series against contenders, without that alone proving that his individual play deteriorated.
Combined percentages require a weighted calculation
Johnson's playoff record was 128-62 in 190 appearances, a 67.37 percent rate. Add that to his 670-236 regular-season record and the combined result becomes 798 wins in 1,096 appearances, or 72.81 percent. That is the correct regular-season-plus-playoff fraction for his career; it is not a claim that he leads a separately qualified combined leaderboard.
A straight average of his two percentages would produce approximately 70.66 percent and would be wrong for combined games. It assigns the 190-game playoff sample the same weight as the 906-game regular-season sample. The correct method adds wins in the numerator and appearances in the denominator, preserving the weight of every game.
The distinction also applies within the playoffs. Winning a best-of-seven series four games to three produces a game record of 4-3 and a series record of 1-0. One can discuss either measure, but a series win percentage cannot be inserted into a game win-percentage calculation. The units must match before the fractions are combined.
Keep separate competitions out of both columns
Modern records introduce another boundary: Play-In games and the NBA Cup championship are separate from the standard regular-season and playoff ledgers. Earlier Cup rounds are already regular-season games. Counting those rounds a second time under a tournament heading would increase both wins and games artificially.
The exclusions are a statistical definition, not a claim that those games lack competitive meaning. A team can celebrate a Cup title and a player can have a memorable Play-In performance without either result changing the particular career rate shown in the main table. Preseason, All-Star and international competition need their own labels too.
For a clean comparison, write the competition beside the minimum: “NBA regular season, at least 500 appearances” or “NBA playoffs, at least the stated playoff minimum.” If the question changes to combined games, rebuild the totals and eligibility from that population. The combined appearances guide explains the two-column counting method; percentage adds the requirement that wins and games use the same scope.
Read an active player's percentage as a dated snapshot
An active career is an unfinished fraction. Every new winning appearance increases both wins and games; a losing appearance increases only games. The final percentage can therefore move in either direction even while the player continues adding meaningful career accomplishments. A retired record provides a stable reference, while an active record needs an explicit date.
Kawhi Leonard illustrates why old search results need care. A dated August 2021 report listed him at 74.5 percent. That was a snapshot of his career at the time, not a permanent entitlement to first place in every later table. Repeating it as his present percentage ignores the additional games played since publication. It should be read historically, with the original minimum and competition intact.
A simple hypothetical shows the effect. A player with 600 wins in 800 games has a 75 percent rate. If he then goes 40-40, his career becomes 640 wins in 880 games, or 72.73 percent. He has added forty victories, but his proportion has fallen because the new segment was below his previous career average. There is no contradiction in those two statements.
The opposite can happen when a player joins a stronger team or enjoys a successful season, although the percentage alone cannot identify the cause. Teammates, opponents, role changes and which games the player actually enters all affect the observed sample. A career-rate change should not be presented as a direct measurement of improved or reduced individual ability.
Before sharing an active ranking, retain five details: the date of the last included game, the competition, the minimum appearances, the wins and the games played. Compare databases at the same cutoff and inspect the game log if their totals differ. A rounded percentage without its underlying record makes even a small discrepancy difficult to resolve.
Use the team schedule directory to follow upcoming opportunities, then confirm the player's appearance in each final box score. Games scheduled for his team cannot be automatically added to his denominator. Neither can future team results be used to predict his final career position with certainty.
With the stated 500-game regular-season minimum, Johnson's checked career rate leads at 74.0 percent. With a 1,000-game regular-season minimum, Ginobili leads at 72.1 percent. Keeping those qualifications attached gives fans two useful records and a reliable way to understand the next leaderboard they encounter.
Sign in with Google to join the discussion.