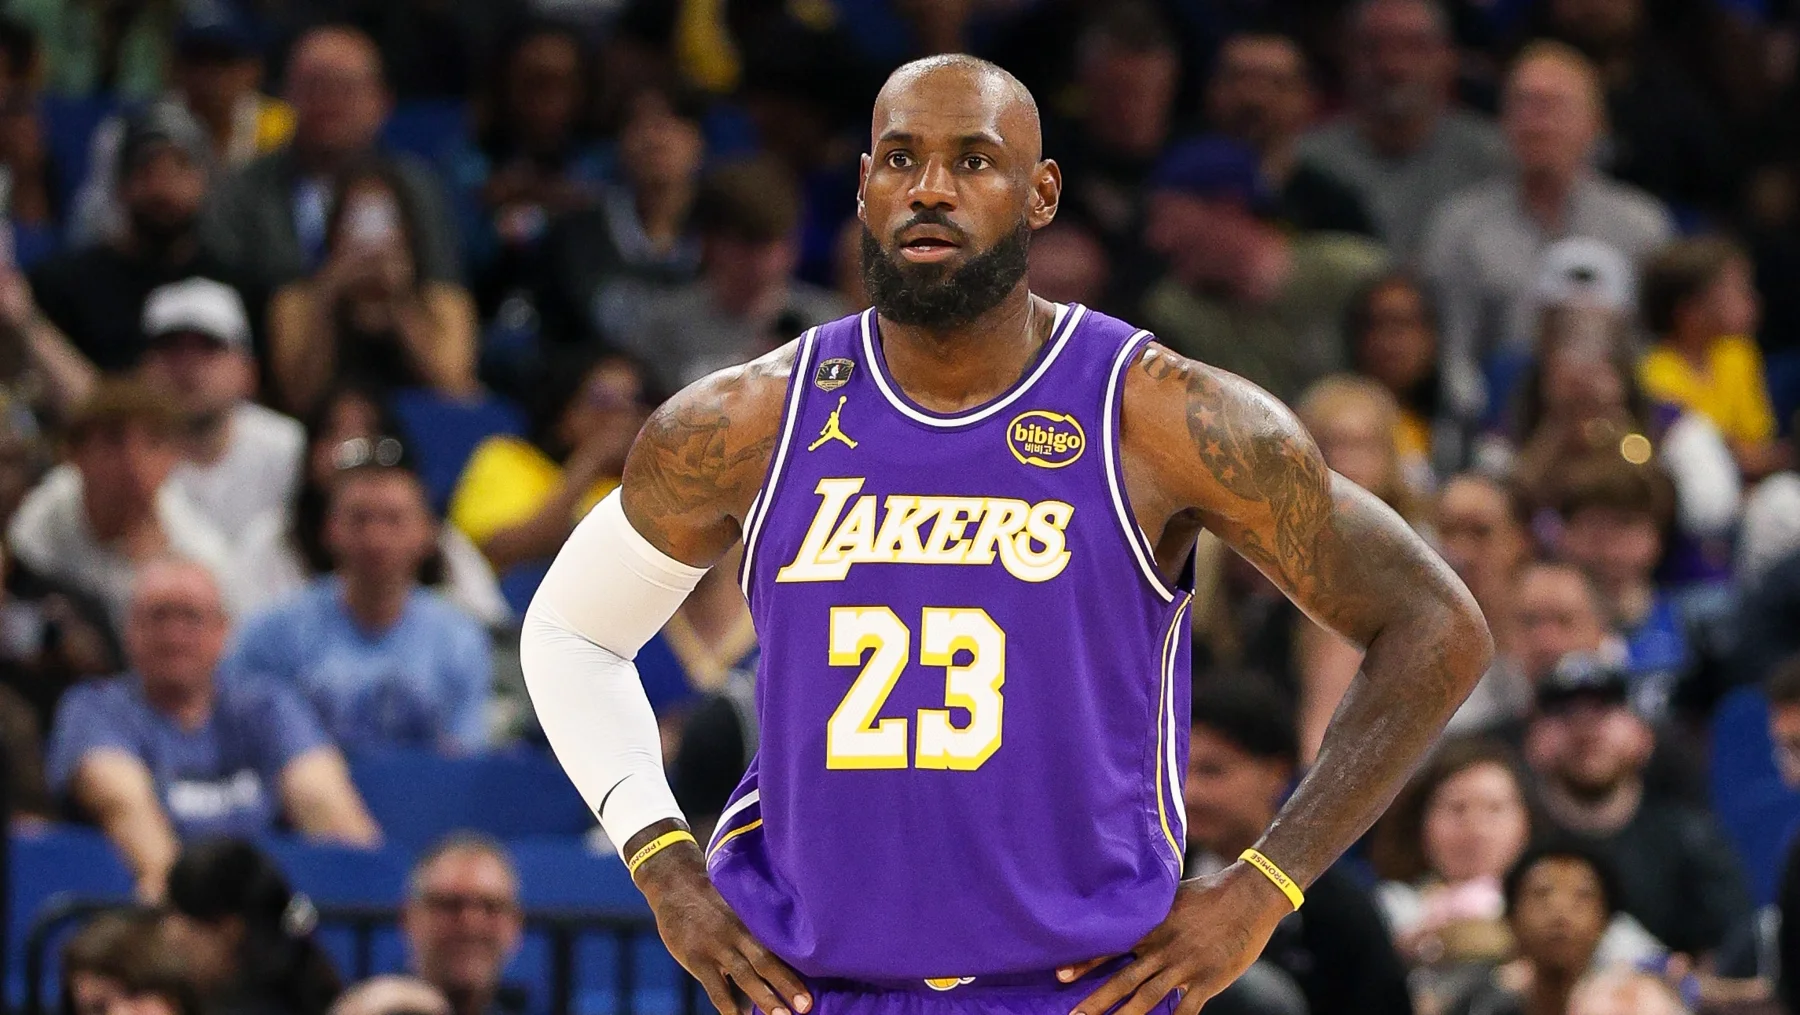
LeBron James leads the combined NBA games played list
LeBron James has the most NBA games played including playoffs: 1,924 through the completed 2025-26 season. That combines 1,622 regular-season appearances with 302 playoff appearances. Kareem Abdul-Jabbar is second with 1,797, and Robert Parish is third with 1,795. Figures here were checked on October 19, 2026, before the next regular season began; James remains an active player, so his number can change.
The useful leaderboard shows the two components together. A regular-season list measures the long winter grind. A playoff list adds repeated qualification, advancement and availability when a rotation tightens. Combining them produces a career appearance count, with each official game worth one regardless of whether a player logged forty minutes or a brief substitution.
| Rank | Player | Regular season | Playoffs | Combined |
|---|---|---|---|---|
| 1 | LeBron James | 1,622 | 302 | 1,924 |
| 2 | Kareem Abdul-Jabbar | 1,560 | 237 | 1,797 |
| 3 | Robert Parish | 1,611 | 184 | 1,795 |
| 4 | John Stockton | 1,504 | 182 | 1,686 |
| 5 | Karl Malone | 1,476 | 193 | 1,669 |
| 6 | Dirk Nowitzki | 1,522 | 145 | 1,667 |
| 7 | Tim Duncan | 1,392 | 251 | 1,643 |
| 8 | Vince Carter | 1,541 | 88 | 1,629 |
| 9 | Kevin Garnett | 1,462 | 143 | 1,605 |
| 10 | Kobe Bryant | 1,346 | 220 | 1,566 |
All ten played their entire professional major-league careers outside the ABA, so their combined figures require no ABA subtraction. That detail matters when searching a database headed “NBA & ABA.” Further down such a table, another player's total may include a different league. A familiar website title alone does not establish that every row answers an NBA-only question.
James's margin over Abdul-Jabbar is 127 games. For perspective, that is more than an entire standard regular season, even before asking how a player would obtain additional postseason opportunities. It makes the combined record a different chase from a closely packed one-season leaderboard. A challenger needs years of health and a continuing place in a coach's rotation, followed by enough successful team seasons to add spring games.
The ranking also rewards adaptation. A veteran can move from first option to complementary scorer, from starter to reserve, or from thirty-five minutes to a carefully managed role and still add appearances. That flexibility is part of longevity. It should not be confused with an argument that every game on the ledger carried the same basketball responsibility.
What counts as an NBA career appearance?
A career games figure needs a precise competition label. This article counts NBA regular-season games and NBA playoff games in which the player actually appeared. It does not count every game his team played during his employment, every night he was on the active roster, or every game for which he dressed. A player who never enters has not added an appearance.
Add regular-season games and playoff games once
The calculation is simple: combined appearances equal regular-season GP plus playoff GP. Starts are a subset of appearances, so they must never be added again. Team stints also need care. If a traded player's season table displays individual team rows and an overall total, add either the team rows or the overall row. Adding both duplicates that season.
Imagine a player with 900 regular-season appearances and 100 playoff appearances. His combined total is 1,000. If twenty of those postseason games were in the Finals, the total remains 1,000 because the Finals are already included in the playoffs. If he started seventy of his playoff games, the starting figure also changes nothing. Those are descriptive subdivisions, not additional appearances.
Likewise, a Cup quarterfinal does not become two games because it has both tournament and regular-season importance. The result belongs in the regular-season ledger once. A game going to overtime remains one appearance too. Overtime increases minutes and physical demand; it cannot increase GP beyond one for a player in that game.
Keep Play-In, exhibitions and the Cup final outside this total
Play-In games occupy a separate statistical category. Their appearances do not belong in either column above. That boundary is easy to miss because television coverage treats the Play-In as the start of the postseason experience. For a statistical query, however, “after the regular season” and “NBA playoffs” are not interchangeable phrases.
The NBA Cup championship is also excluded; earlier Cup rounds count through their regular-season entries. Milwaukee's 2024 title game against Oklahoma City illustrates why a memorable competitive performance can sit outside the standard career ledger. Fans can value that night without changing the definition of the record they are comparing.
Preseason games, All-Star appearances, Olympic games and games in other professional leagues are outside this NBA-only calculation. That is a boundary on the question, not a judgment about their intensity or significance. When following a milestone through the NBA games today schedule, check the event type before adding an upcoming appearance. A preseason appearance on the eve of Opening Night does not move this table.
Why Kareem passes Parish when the playoffs are included
The clearest demonstration of the combined calculation sits immediately below James. Parish played 51 more regular-season games than Abdul-Jabbar: 1,611 against 1,560. Abdul-Jabbar played 53 more playoff games: 237 against 184. The postseason advantage cancels the regular-season deficit and leaves Abdul-Jabbar ahead by exactly two combined appearances.
Nothing about either retired player's career has changed when the ordering flips. Only the question has changed. A list placing Parish above Abdul-Jabbar can be correct for regular-season appearances, while a list putting Abdul-Jabbar above Parish is correct for combined appearances. Removing the competition labels makes two accurate tables look contradictory.
Both centers sustained long careers, but their journeys were not identical. Abdul-Jabbar won six NBA championships, with Milwaukee and Los Angeles. Parish's Boston years put him in the middle of another defining championship era. Their teams supplied recurring opportunities to play meaningful spring games. The leaders needed to be available to take those opportunities; teammates and organizational quality helped create them.
The basketball lesson is that durability has several forms. An interior player can remain useful through positioning, timing and finishing even as explosive movement becomes harder to sustain. That is an analytical explanation of how a long career can survive changing responsibilities, rather than a claim that a specific skill accounts for every extra game. Injury history, coaching choices and roster competition still intervene.
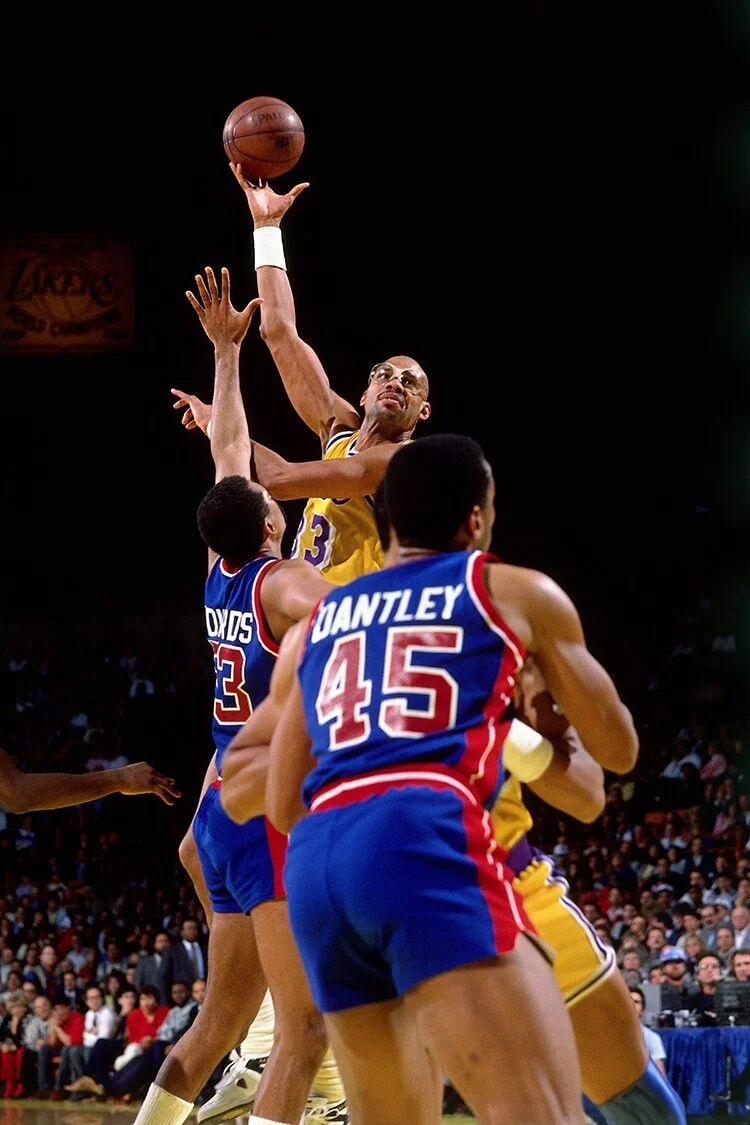
This is also why a career ledger should not be reduced to rings. Winning a title supplies a successful endpoint, but the path can contain shorter or longer series. A losing finalist may appear in more games that spring than the champion. Counting appearances records the games that happened, not a hypothetical maximum based on trophies.
For a broader comparison of the environments that generated those runs, our greatest NBA teams discussion considers teams across eras. Here, the narrow and verifiable conclusion is more useful: Abdul-Jabbar's 53-game playoff edge exceeds Parish's 51-game regular-season edge. Two numbers explain the reversal without requiring an argument about which center deserves a higher place historically.
Postseason longevity reshapes the rest of the leaderboard
Duncan and Carter offer another revealing comparison. Carter's 1,541 regular-season appearances exceed Duncan's 1,392 by 149. Duncan's 251 playoff appearances exceed Carter's 88 by 163. The combined result favors Duncan, 1,643 to 1,629. Carter's exceptionally long NBA career and Duncan's extensive postseason career can both be appreciated without forcing them into the same durability story.
It is tempting to divide a playoff total by 82 and describe the answer as extra seasons. That is useful scale, but it is not a literal schedule equivalence. A playoff run has different preparation, opponent familiarity and rotation demands. Travel repeats between the same cities, scouting becomes more specific, and a weak matchup can remain a problem across an entire series.
A deep run creates opportunity, not automatic greatness
Derek Fisher's 259 playoff appearances demonstrate that the top of a postseason games list includes vital supporting players as well as franchise stars. A reliable guard who fits beside elite creators can remain playable across successive rounds. Coaches need a rotation that survives opponent adjustments; earning another assignment in that environment has value even when the player is not the offense's central engine.
Nevertheless, an appearance does not estimate individual impact. It gives Fisher and a superstar teammate the same one-game increment if both enter. It cannot tell us who generated the advantage, defended the hardest matchup or carried the creation burden. That requires watching the games and considering role, efficiency and the strength of the surrounding lineup.
Series length adds another wrinkle. Consider two hypothetical finalists: one sweeps three rounds, while the other needs seven games in each. Before the Finals, their healthy rotation players could have twelve and twenty-one appearances respectively. The second team has produced nine more opportunities without necessarily being the better team. Advancing matters enormously, but accumulating games is not the same as dominating.
This is why the combined table belongs beside, rather than inside, a greatness verdict. A reader making an all-time argument can use it as evidence of sustained participation, then turn to our tiered greatest-player ranking for a wider discussion of peak and career value. The appearance ledger is strongest when it stays faithful to its narrower purpose.
Compare durability across eras without erasing the context
The official total should remain the total. An appearance leaderboard does not need invented extra games to honor someone whose schedule offered fewer opportunities. Interpretation, however, improves when the available calendar is visible. A record describes what happened under the rules of its time; an era comparison asks a broader question about those conditions.
Schedule length and playoff format change the ceiling
The NBA first used an 82-game schedule in 1967-68. Later careers still encountered interruptions: 1998-99 had fifty regular-season games, and 2011-12 had sixty-six. Missing opportunities because a league schedule is shortened is different from sitting out an available game. Simply multiplying a player's number of seasons by 82 therefore produces a misleading career denominator.
The playoff ceiling changed too. The first round became best of seven in 2003. A modern first-round series can supply as many as seven appearances, while the preceding best-of-five format allowed at most five. Across a long career with frequent qualification, that difference can accumulate. It does not justify adding two hypothetical games to every old series; some would have ended before the limit.
The clean comparison keeps two questions separate: who played the most actual games, and who was available for the largest share of his team's possible games? The first has the table above as an answer. The second needs a season-by-season denominator and careful treatment of trades, shortened schedules and playoff qualification. Career seasons alone cannot provide it.
Games and minutes answer different workload questions
A hypothetical reserve appearing eighty times at ten minutes per game logs 800 minutes. A starter playing sixty-five times at thirty-six minutes logs 2,340. The reserve wins the appearances comparison; the starter spends almost three times as long on the court. Neither calculation is wrong. They describe different aspects of participation.
Even minutes cannot capture everything. Guarding a primary creator, carrying a large offensive creation load and playing through repeated overtime possessions are different assignments from spacing the floor in a limited role. Those observations explain why coaches consider more than a career GP total when planning rest. They do not establish a universal formula for injury risk or fatigue.
For fans, the practical habit is to label the claim before repeating it. “Most appearances,” “most minutes,” “most seasons” and “highest availability rate” can point to different players. James's lead in combined appearances stands on its own. It becomes less informative, rather than more impressive, when every other measure of longevity is silently folded into the same number.
How to check an active player's total after the next game
Begin with a cutoff rather than a search snippet. “Through the 2025-26 playoffs” is reproducible; “today” becomes ambiguous as games finish in different time zones. If two websites disagree by one or two appearances, first establish whether they include the same latest completed game. A difference in refresh time is not necessarily a difference in statistical policy.
Open the player's career statistics and read regular-season GP with the regular-season filter selected. Then select playoffs and read playoff GP. Add the two figures. If working from individual season rows, use career totals as a check and inspect any traded season for a combined team row. The arithmetic should reconcile before the number is shared.
Next, open the final box score for a game that finished after your table's cutoff. Confirm that the player entered. An injured player whose team won, a healthy reserve who never checked in and a player listed in a pregame lineup projection have different statuses, but none has necessarily added GP. A starting-lineup announcement is evidence of an intended role, not a completed statistical appearance.
Historical news needs the same discipline. James passed Parish with regular-season appearance number 1,612 on March 21, 2026. That milestone report remains correct as a dated event. It does not freeze his career at the number in its headline. The career table and a contemporary article serve different jobs: one updates the ledger, while the other preserves the moment a threshold was crossed.
For a future milestone watch, use the team schedule directory to identify possible game dates, then confirm health and participation on game night. Never assume that five scheduled games mean five new appearances. Postponements, rest and rotation decisions can all move the estimated date without changing the record's counting rule.
The answer at this article's cutoff is therefore precise: James leads with 1,924 combined NBA appearances, Abdul-Jabbar follows at 1,797, and Parish has 1,795. Keeping regular season and playoffs in separate columns makes that answer easy to audit and easy to update. It also lets the accomplishment speak clearly without confusing it with minutes, team games or an all-purpose ranking of basketball greatness.
Sign in with Google to join the discussion.